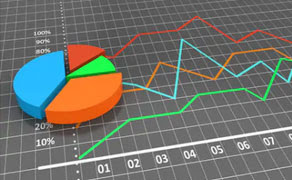
Application of technical analysis tools is more important than just learning them.Tecnical analysis is study of history price and data including price and volume.The technical analysis is price with valume worked in present past and future times.This is three way formaed by 1. line chart 2. Bar chart is defind high low open and close chart position. 3. Candlestick chart is defined same position high low open and close.Tecanical analisis what is how to work and what is the used. 1, for ex. If cloud is the candle than rainy water is as the trend.same definision cloud is any behave changes just candle is same perform at as rainy water campair to trend turn with valu in the markets.all change covered processing is technical analysis. 2.this three kinds is to do works.1,candlestick pattern 2.charts pattern 3. Indicater analysis. 1, candlestick pattern is two types bullish white and bearish black this depand on the basicaly chart pattern the can be calculate with microsoft websites.the calculation time period is gived best result. 2. Chart pattern is basicaly three months six months and one year to maked and worked this all conversation.Chart is all ready all time is formed for attention invest to investers.3. Indicater is hundred types but sone one to can be used fo best result.his the worked are the help with computer.indicater is fixed mesurment to alert ago trading.the best indicater all with (RSI).Fundamental analysis the new trader for profit doesn't invest in share market with extra experience need from technical analysis help. If company share analysis don't solved fron without technical analysis helped. Atleast the share stock marke is very sensetive and carefully up and down market is calculate critical points to defined with feber himself for work done.stop loss theory is batter converter so at usefull profit achhvement.

Comments
Post a Comment
9835492904